167 Shocking Technology Statistics & Facts You Need To Know In 2023
- As of July 2020, the number of internet users has reached a whopping 4.6 billion users worldwide, encompassing 59% of the world’s entire population. (2) This is equivalent to over 4 billion more users since 1997, when there were only 36 million people online.
- There are over 570 websites created every minute adding up to a total almost 1.8 billion websites since 1991 (3)
- Google gathers over 3.5 billion searches per day and up to 1.2 trillion searches per year. (48)
- Over 90% of the world’s data were created only in the last couple of years. (49)
- The worldwide spending on technology has reached $3.4 billion. This is based on every household and business spending money on new gadgets and tech, including phones, tablets, computers, and more. (2)
- Because of COVID-19, 76% of businesses are planning on long-term IT changes. (10)
- 34% of people map out their “to-do lists” on paper. Only 22% use online tools, 18% use a calendar on their phones, 17% use project management systems, and the last 9% use other methods. (19)
- The percentage of remote workers in the United States jumped from 31% to 62% in just three weeks because of the Covid-19 pandemic. That is double the amount of the previous number. (20)
Technology Growth Statistics
This section will tackle facts and statistics on technology growth. It will include facts about how far and what has become of technology in this modern day and age.
It feels like every decade, there is something new. For example, in the 90s, not everyone thought that you can fit as much processing power into a small device such as a smartphone. The latest computers at that time are not even close to the processing power that you can fit in your pocket today.
- 43% of teachers used online games in the classroom. (7)

- Businesses will increase their cloud-based services and decrease their hardware spending in 2021. (10)
- 44% of businesses are planning or already accelerated their digital transformation, due to COVID-19. (10)
- 30% of businesses plan to develop training campaigns for hiring and training remote employees. (10)
- 32% of businesses plan to connect their employees using secure, standardized, and easy-to-use platforms. (10)
- There are 7.75 billion people on this planet, and more than half of the entire population has access to the internet. (53.6%) (11)
- The Total amount of data has reached 59 zettabytes in 2020. (54)
![]()
Technology Addiction Statistics
Because of all the things you could do with modern gadgets and the internet, a lot of people are addicted and glued to their phones, which is both a good and bad thing.
You can either get the information you need or overload your brain with information. Technology is a double-edged sword. It can either be helpful or harmful, depending on how you use it.
- 72% of teens feel the need to immediately respond to a text, social media notifications, and other mobile notifications. (12)
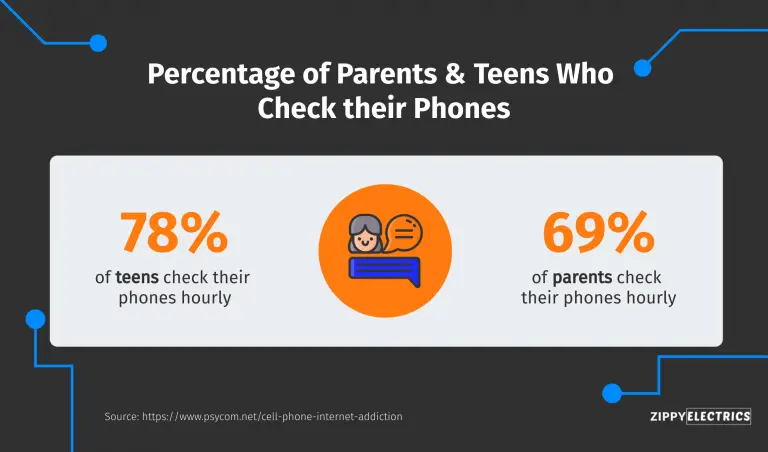
- 78% of teens check their phones hourly. (12)
Communications Statistics
Communication statistics are very very important, especially if you own a business. Knowing how communication can affect the performance of your employees, and how you can get clients is a great way to make your business sustainable.
Here are some communication statistics that are relevant to businesses, and good to know whether you are the CEO or an employee. It can help you communicate well with colleagues.
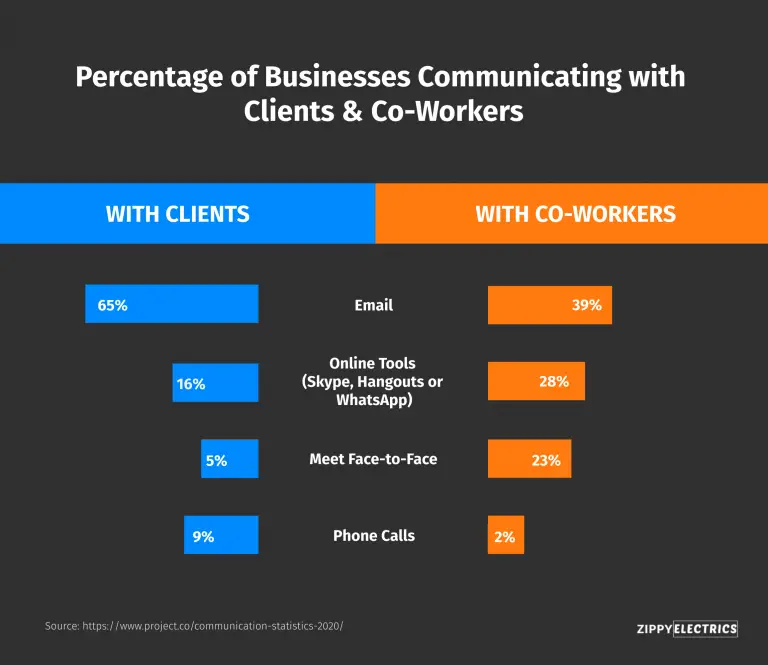
- 65% of businesses resort to email for communicating with their clients. 16% use online tools, 9% use phone calls, and 5% meet face to face. (19)
- In businesses, 39% use emails for communicating with co-workers. 28% use online tools such as Skype, Hangouts, or Whatsapp.23% meet face to face, and only 2% use phone calls. (19)
- 63% of the population has missed a message or important information that went into another colleague’s inbox when that person was away on vacation or absent. (19)
- 74% of potential or existing clients stop dealing with a company or firm because of disorganization. These customers tend to move to their direct competitors. (19)
- 92% of the people had to repeat a piece of information to two or more people in an organization. (19)
- In an organization, 85% of the people find it annoying when having to repeat information when working with other businesses. (19)
- 95% of people think that those businesses they deal with could improve their communication and management. (19)
- Leadership communication is the top internal communication factor that correlates to engaged employees statistically. (20)
- Corporate employees spend 25% of their workday doing various email-related tasks. (20)
- 4 out of 5 employees believe that better internal business communications help their performance. (20)
- One of the biggest challenges of working with remote employees is the language barrier. (20)
- 60% of companies do not have any long-term plans and strategies for internal communication. (20) Based on all the communications statistics on this list, good communication almost always leads to the betterment of the company and the performance of the employees.
- 61% of companies are planning to switch to Voice over Internet Protocol (VoIP) phone systems in the next few years. (29)
- By the end of 2020, worldwide corporate VoIP subscribers are expected to hit 204.8 billion. (30)

Here is the top VoIP software that most companies are using today:
- Slack – It is a reliable collaboration software. It is a single platform for communicating through video and it features integrated and secure file sharing within a company.
- Ooma Office – It is a great communication solution for businesses. It offers easy communication channels and excellent customer support.
- RingCentral – It is one of the most reliable and secure VoIP software that provides sophisticated communication tools. It allows users to manage business communication channels without the use of any third-party apps.
Internet Statistics
The internet is the information superhighway that was invented almost half a century ago. It wasn’t only until recently, however, that it also became a prominent and essential factor in most businesses and individuals.
Without the internet, you wouldn’t be able to communicate and get information in seconds. Without the modern devices and data that are linked to it, however, companies could not access their cloud-based data whenever they need to. Here are some interesting and shocking facts about the internet.
- 65% of the entire internet population has at least lost one file in their own inbox or on a personal hard drive. (19)
- There are one million new internet users each day based on the latest statistics. (21)
- The online penetration rate is now at 57% globally. (21)
- An average internet user spends 6 hours and 42 minutes on the internet on a daily basis. (21)
- 48% of internet browsing is spent on a mobile device like a smartphone or tablet. (21)
- There are 3,511.41 secure internet servers in one million people globally. (22)
- The average cost of a malware attack on companies is 2.4 million dollars. (22)
- The average time to resolve a malicious attack is 50 days. (22)
- Security breaches average at 130 each year. (22)
- There are 615 million devices equipped with ad blockers globally, and 90% of those devices are from people in Asia, based on the reports. (26)
- 80% of Americans use at least one ad-blocking method, whether it is an app or something on the phone settings. In North America, 50% of the entire adult population uses two ad blockers for their devices. (27)
- People use ad blockers because of irrelevant and annoying ads, and the penetration rate is now at 27% in 2017 and projected to double in the following years. (28)
Social Media Statistics
Social media is one of the most popular platforms on the internet. It is a great invention that connects family members, lost connections, and old and new friends.
You will discover some interesting facts about social media and how it can affect businesses through ads and other promotional factors. Facebook makes most of its revenue through ads because they are effective.
- As of 2020, an estimated 3.6 billion people are using social media in the entire world. (15)
- It is projected that worldwide social media usage would increase to almost 4.41 billion by 2025. (15)
- Football player, Cristiano Ronaldo has the most popular Instagram account. His Instagram account has over 239 million followers. He also ranks first for the value of his Instagram posts, valued at 735,386 USD. (16)
- Instagram’s own account ranks number one with more than 369 followers. (16)
- Instagram has over 1 billion monthly active users, and 112 million users are from the United States. It is projected that the monthly active users will surpass the 120 million mark by 2023 in the US. (16)
- Half of Instagram users in the United States are 34 years old and younger. (16)
- Facebook has a total of 2.7 billion monthly active users as of the first half of 2020, and over 3.14 billion people are using at least one of Facebook’s core products (WhatsApp, Instagram, and Messenger). With that being said Facebook is the most popular social media app in the world. (17)
- Facebook has over 300 million photos uploaded, 800 million likes, and over 175 million heart reactions per day. (3)
- One in seven divorces blames Facebook. (3)
- There are 340,000 Tweets sent per minute and that is around 500 million Tweets per day. (3)
- Social media’s penetration rate is at 45%. (23)
- There are 3.5 billion social media users as of 2019, and 3.256 billion of those use mobile devices. (24)
- Filipinos spend the most time on social media, averaging 4 hours and 12 minutes daily, as opposed to the 2 hours and 16 minutes that people spend on social media worldwide. (24)
- Video content, images, and other visual content are most likely to be shared on social media than written articles. These are the video clips and photos that go viral and reach up to billion views on social media platforms alone. (25)
Search Engine Statistics
In the age of the internet, your search engine is your way of searching for almost anything you need to find. Optimizing your business for search engines is a great way to get clients to buy your products.
Here are some facts about search engines you might want to know:
- There are 24 hours of content uploaded on YouTube every minute. Another fun fact is that more video content is uploaded on this website in 60 days than three major television networks in 60 years. (3)
- In July 2020, Bing accounted for 6.43% of searches, while Google had a market share of 86.86%. (43)
- Google earned one of the highest revenues in tech, amounting to roughly over $160.74 billion in 2019. (43)
- Mobile searches account for 50.71% of searches. (44)
- Only 13% of all the websites are able to retain the same rank in Google searches across all devices. (45)
- According to SEO tools like SEMRush, 71.76% of domains move in the rankings on mobile compared to desktop or laptops. (45)
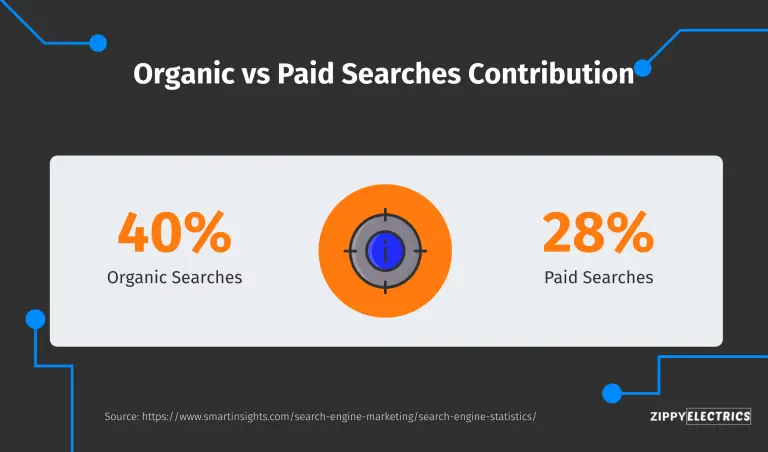
- Organic searches, at 40%, still contribute more than paid searches at 28%. (45)
Hardware and Gadgets Statistics
Without any gadgets, people wouldn’t be able to surf the web, play video games, get all the information they need, or communicate. Here are some of the latest facts and statistics on gadgets and hardware.
- There are more than 100 million iPhone users in the United States alone. It accounts for about 45% of all the smartphone users. (53)
- More than 90% of millennials own smartphones. (6)
- 90% of Generation X own smartphones. (6)
- 68% of Baby Boomers own smartphones. (6)
- 40% of the Silent Generation owns smartphones. (6)
- 91% of teachers have computers in their classrooms. (7)
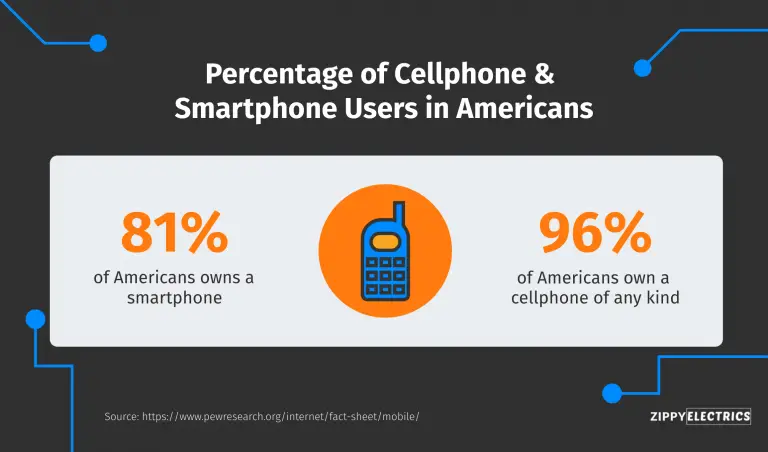
- 81% of Americans own a smartphone and 96% own a cellphone of any kind. (13)
Information Technology Statistics
For using sophisticated software, a company or individual requires advanced devices or infrastructures that can accommodate them. Organizations are expected to go through digital transformations and initiatives such as increasing budgets, investment in new software, and higher demands for jobs in the industry.
- The worldwide information technology industry has almost reached $5 trillion in 2019 (4)
- The worldwide information technology is expected to make $1,911.2 billion in revenue by 2021. This statistic is projected from 2016 to 2021 based on the growth percentage. (5)
- The IT budget will experience a slight decline in 2021, but 80% of businesses anticipate the spending on tech will increase or stay the same. (10)
- The internet industry is worth $2.1 trillion in the United States alone. (9)
- 36% of businesses plan to improve their IT operations performance due to the 2020 pandemic. (10)
- The employment of software developers is projected to grow by up to 22% from 2019 to 2029. (15)
Artificial Intelligence Statistics
The rise of technology is causing more and more computers and AI to take over some jobs. It could be a bad thing for people losing their jobs, but a good advancement in tech and companies that can save money in the long run.
Today’s executives are willing to pay more to get more from their operations, no matter what is the nature of their business. Below are some facts about AI and automation statistics that are not only relevant to businesses, but to individuals as well.
- 10 million self-driving cars will be on the road by the end of the year. (51)
- By 2030, it is expected that AI will contribute 15.7 trillion dollars to the global economy. (31)
- 83% of organizations have observed benefits after implementing automation technologies. (32)
- The top uses for AI and IT automation is 46% cybersecurity, 37% for customer service, 41% predictive analysis, and 47% quality control.
- Machine learning has an adoption level of 63%. (32)
- 58% of all companies state that they have undergone at least six full AI implementations last year alone. (32)
- 61% of internet users believe that AI will affect employment. (33)
- Companies focus on hiring skilled professionals for enhancing AI initiatives. 30% of them are AI researchers, 30% of them are AI software developers, 24% are AI data scientists, 23% are user experience designers, and 22% are change management experts. (32)
Big Data and Analytics Statistics
Big data has been around since the 90s. However, the term was only coined in 2005 because back then, there was not enough data to analyze, since 90% of the world’s data were only generated in the last two years.
- The revenue for big data and business analytics reached $189.1 billion in 2019. (34)
- The global IP traffic from cloud farms and data centers have reached a whopping number of 10.6 zettabytes in 2018. (34)
- By 2023, the big data market is expected to be worth $77 billion. (35)
- By the end of the year, each human is expected to generate 1.7 Mbps according to experts. (36)
- As of 2020, 97.2% of companies are investing in big data. (37)
Cyber Security Statistics
Cybercrime is one of the biggest threats to companies, especially if all their data is stored in the cloud. If you own a business, you should invest in cybersecurity, especially if your data is stored online. Investing in cybersecurity will maintain the security and integrity of customer data and other sensitive and confidential information within the company.
Here are some facts about cybercrime based on the latest statistics:
- Out of the 90,000 websites that are hacked daily, 83% of those are being hosted on WordPress, making it the most hacked content management system in the world. (28)
- Of all the companies, 31% of them have had data and operational technology infrastructure compromised. (29)
eCommerce Statistics
eCommerce can benefit both businesses and individual consumers. With so many online shops to choose from, you can get almost anything delivered straight to your door, from groceries to the newest gadgets.
Transactions are now simplified and we can expect to see more eCommerce businesses and consumers to emerge in the years to come.
- Based on digital payments alone, the number of eCommerce users is expected to reach 4.636.4 million by the year 2024. (37)
- Every year, the spending on eCommerce is growing by 11.3%. (38)
- The average revenue per user is $539.90 per sale. (38)
- eCommerce accounts for 14.1% of all retail transactions worldwide. (39)
- The most important factor for consumers when choosing products to buy is free shipping. (39)
- Consumers make most of their purchases on a mobile device (51%) rather than a desktop or laptop computer. (39)
- 68.8% of people abandon their online shopping carts. (39)
- China is the biggest and fastest eCommerce market in the world with over $1.935 trillion in sales. (39)
- The most popular method of payment in eCommerce is credit cards. (39)
- It is also expected to keep growing, reaching up to 22% of all sales by 2023. (40)
- In 2019, global eCommerce sales reached the 3.5 trillion dollar mark. (40)
- More than 70% of the population will rather read an article or blog post to learn about a brand, than watching or reading a traditional advertisement. (46)
- 2.72% of all site visitors on eCommerce websites will likely purchase something. (47)
![]()

The same goes for music. When iTunes came out, a lot of people switched from buying physical albums and records to buying singles and digital albums off iTunes. The emergence of streaming platforms like Spotify changed the game. Artists now upload their music and you can listen to almost any track or even podcasts by paying for monthly streaming services.
Ever since then, Apple has changed iTunes to Apple Music and Apple Podcasts to compete with streaming services like Spotify, Amazon Music, Deezer, and YouTube Music.
Here are some facts about streaming services that would be good to know if you are in the movie and music business:
- According to Satista, 27.2% of online viewers spent more than 10 hours of streaming on a weekly basis as of August 2020. (50)
- Spotify has around 108 million subscribers,which is almost 40% more subscribers than Apple Music. (52)
- Netflix attributes to almost a third of TV viewing and usage at 31%. YouTube ranks second at 21%, Hulu at 12%, and Amazon prime at 8%/. (41)
- In 2019, Lucifer is the most-watched show on Netflix, followed by Stranger Things, 13 Reasons Why, Money Heist, and Orange Is the New Black. (41)
- Disney+ earned 10 million subscribers on its first day of launch. (41)
- Music streaming surpassed the 1 trillion mark in 2019. (41)
- 89% of the worldwide population listen to music streaming services in a 2019 survey. (42)


References
- https://en.wikipedia.org/wiki/Software_as_a_service
- https://www.statista.com/statistics/617136/digital-population-worldwide/
- https://www.statista.com/chart/19058/how-many-websites-are-there/
- https://www.comptia.org/content/research/it-industry-trends-analysis
- https://www.statista.com/forecasts/959558/it-revenue-in-the-world
- https://www.pewresearch.org/fact-tank/2019/09/09/us-generations-technology-use/
- https://www.casbo.org/sites/default/files/userfiles/CASBO_Final_White_Paper.pdf
- https://www.educationdive.com/news/report-96-of-public-schools-have-adequate-internet-for-digital-learning/538664/
- https://www.google.com/search?q=how+much+is+IT+sector+worth&rlz=1C5CHFA_enPH858PH858&oq=how+much+is+IT+sector+worth&aqs=chrome..69i57j33l7.8001j0j7&sourceid=chrome&ie=UTF-8
- https://swzd.com/resources/state-of-it/
- https://en.wikipedia.org/wiki/Global_Internet_usage
- https://www.psycom.net/cell-phone-internet-addiction
- https://www.pewresearch.org/internet/fact-sheet/mobile/
- https://www.bls.gov/ooh/computer-and-information-technology/software-developers.htm
- https://www.statista.com/statistics/278414/number-of-worldwide-social-network-users/
- https://www.statista.com/statistics/421169/most-followers-instagram/
- https://www.statista.com/statistics/264810/number-of-monthly-active-facebook-users-worldwide/
- https://www.statista.com/statistics/544001/facebooks-advertising-revenue-worldwide-usa
- https://www.project.co/communication-statistics-2020/
- https://blog.smarp.com/10-shocking-internal-communications-stats-you-cant-ignore
- https://wearesocial.com/blog/2019/01/digital-2019-global-internet-use-accelerates
- https://docs.google.com/document/d/1WlKHVXooY6bpEiccV0Q_OoF4EmjBw5l-djsZY7vHqLc/edit#
- https://www.statista.com/statistics/269615/social-network-penetration-by-region/
- https://wearesocial.com/global-digital-report-2019
- https://blog.hubspot.com/marketing/visual-content-marketing-strategy
- https://blockthrough.com/2017/02/01/adblockreport/
- https://www2.deloitte.com/content/dam/Deloitte/global/Images/infographics/technologymediatelecommunications/gx-deloitte-tmt-2018-adblocking-media-report.pdf
- https://www.statista.com/topics/3201/ad-blocking/
- https://www.blueface.com/wp-content/uploads/2019/01/The-2018-BCT-Report.pdf
- https://www.futuremarketinsights.com/reports/global-voip-services-market
- https://www.pwc.com/us/en/services/consulting/library/artificial-intelligence-predictions-2019.html
- https://www2.deloitte.com/us/en/insights/focus/cognitive-technologies/state-of-ai-and-intelligent-automation-in-business-survey.html
- https://www.bcg.com/publications/2019/citizen-perspective-use-artificial-intelligence-government-digital-benchmarking
- https://www.statista.com/topics/1464/big-data/
- https://www.entrepreneur.com/article/325923
- https://www.domo.com/assets/downloads/18_domo_data-never-sleeps-6+verticals.pdf
- https://www.statista.com/outlook/295/100/fintech/worldwide
- https://www.statista.com/statistics/379046/worldwide-retail-e-commerce-sales/
- https://ecommerceguide.com/ecommerce-statistics/
- https://www.statista.com/markets/413/topic/544/key-figures-of-e-commerce/
- https://www.comparitech.com/tv-streaming/streaming-statistics/#:~:text=89%25%20of%20people%20across%20the,percent%20is%20free%20audio%20streaming.
- https://www.comparitech.com/tv-streaming/streaming-statistics/#:~:text=89%25%20of%20people%20across%20the,percent%20is%20free%20audio%20streaming.
- https://www.statista.com/statistics/216573/worldwide-market-share-of-search-engines/
- https://www.smartinsights.com/search-engine-marketing/search-engine-statistics/
- https://gs.statcounter.com/platform-market-share/desktop-mobile-tablet
- https://www.demandmetric.com/content/content-marketing-infographic
- https://quoracreative.com/article/content-marketing-statistic-trends#:~:text=achieve%20conversion%20goals.-,Content%20marketing%20statistics%20for%20ecommerce,outgrow%20by%20end%20of%202020.
- https://www.internetlivestats.com/google-search-statistics/
- https://www.sciencedaily.com/releases/2013/05/130522085217.htm
- https://www.statista.com/statistics/611707/online-video-time-spent/
- https://www.theguardian.com/technology/2015/sep/13/self-driving-cars-bmw-google-2020-driving
- https://1z1euk35x7oy36s8we4dr6lo-wpengine.netdna-ssl.com/wp-content/uploads/2018/12/spotify-vs-apple-music-subs-1.jpeg
- https://www.statista.com/statistics/236550/percentage-of-us-population-that-own-a-iphone-smartphone/
- https://www.statista.com/statistics/871513/worldwide-data-created/
zippyelectrics.com may earn commissions when you purchase items through links to external source such as Amazon. Read our affiliate disclosure here.